By definition, forecasting is uncertain. Thus, when you use one or more of the forecast calculators please keep in mind that the answer you get is just an estimate and actual results can vary widely.
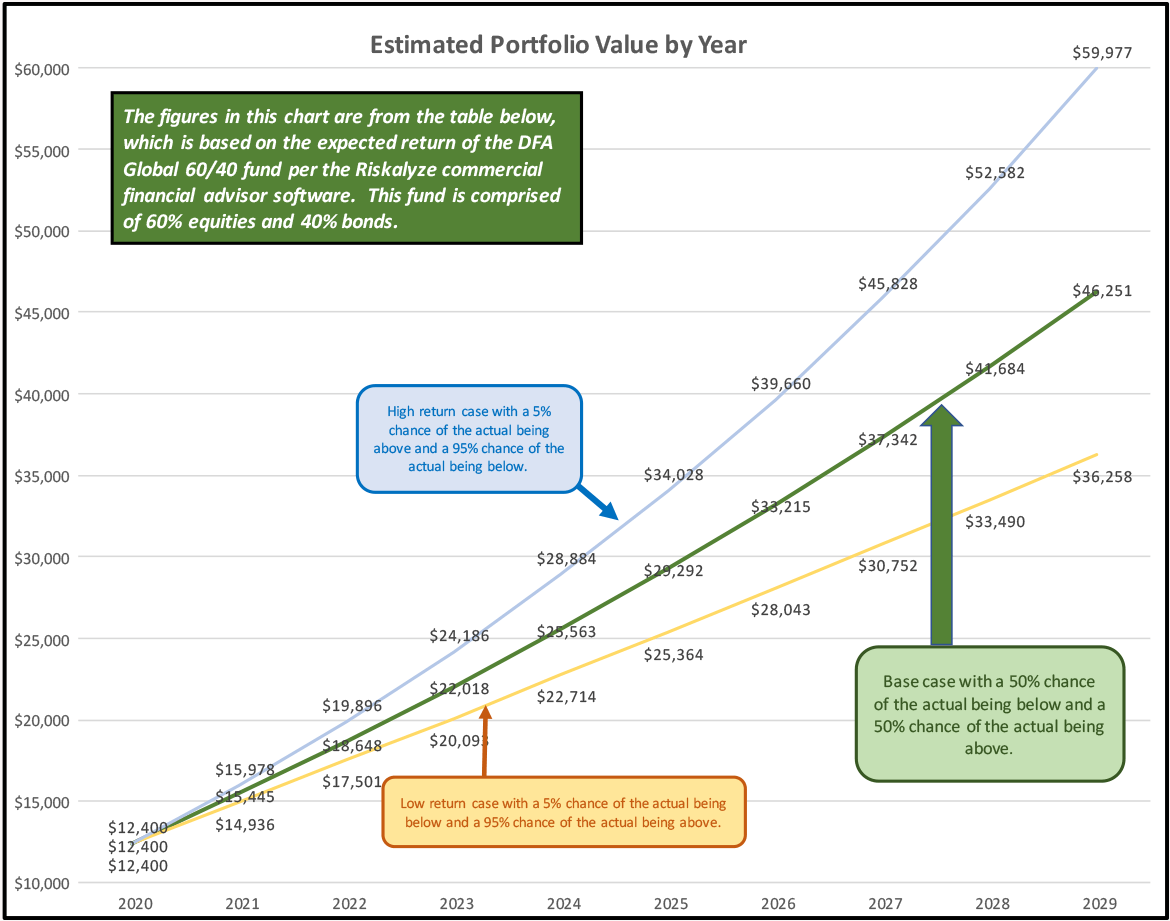
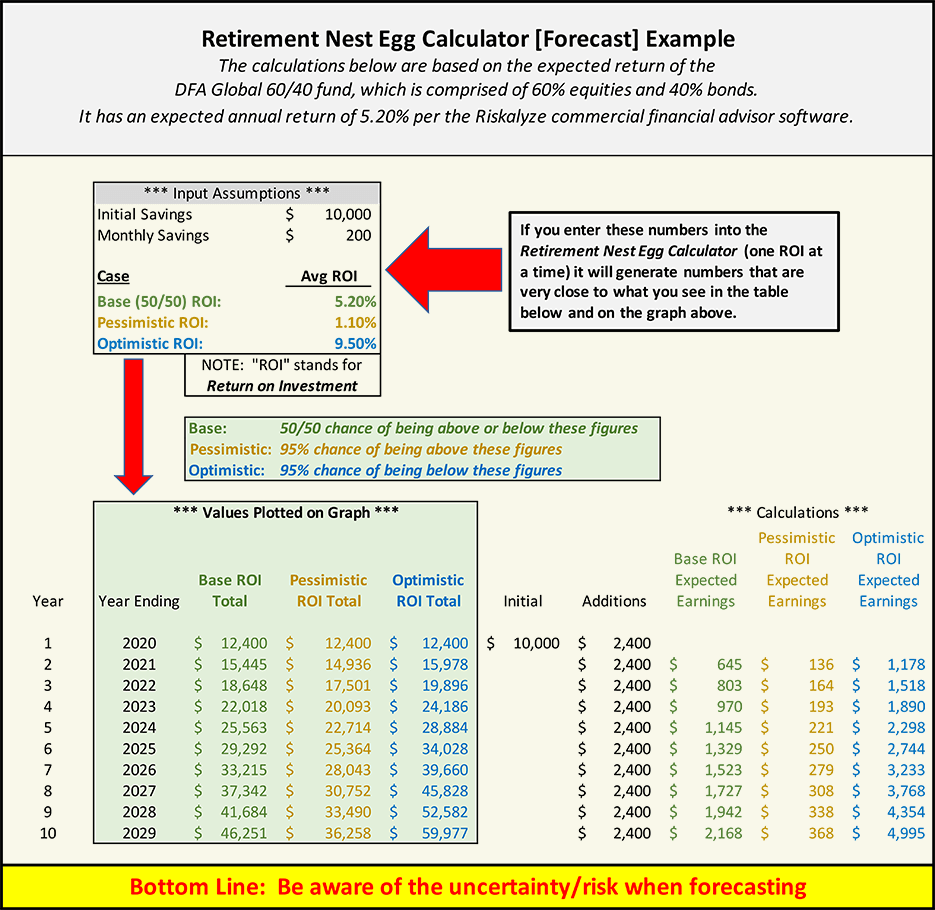
For example, using the Base Case input data (see table that comes after the graph) and commercially available financial planning software:
- The low return case (actual result has a 95% chance of being greater than yellow-brown line) has a calculated year 2028 value of $33,490.
- The base case (actual result has a 50% chance of being less and a 50% chance of being more) has a calculated 2028 value of $41,684.
- The high return case (actual result has a 95% chance of being less than the blue line) has a calculated year 2028 value of $52,582.
For simplicity and cost reasons, the forecast calculators on this web site do not generate the low and high return probability cases like that described in the graph above.
However, one can use the simple forecast calculators on GreatWealth.com to generate a range of results by entering different input assumptions. This allows you to quickly and easily get an idea of how much and how long you need to save, as well as what kind of a return on investment (ROI) you need, to reach your financial goals. One can get a better idea of reasonable returns and risks/uncertainties to expect from the book Great Minds. Great Wealth. Great for Your 401k.
Chapter 3 of Great Minds. Great Wealth. Great for Your 401k. has an excellent discussion of risk and uncertainty.
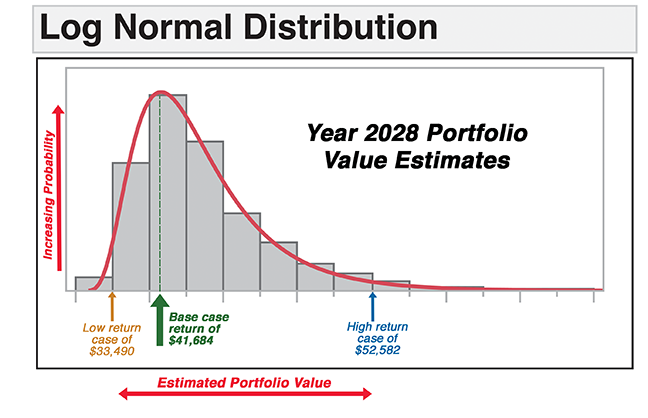
The “Log-Normal Distribution” chart is another way of showing the likelihood of what is forecast to happen in year 2028 of the “Estimated Portfolio Value by Year” chart. In this case the right skew is exaggerated to illustrate the positive skewness of likely return distributions. As mentioned in the table above, one can generate the flow stream of numbers for each of the above cases, and other cases in between, using the Retirement Nest Egg Calculator.
Per the Log Normal Distribution chart above it is easy to see the investor, using the inputs in the table, has a:
- 50% chance of being to the right of the green arrow on the Log Normal plot
- 50% chance of being to the left of the green arrow on the Log Normal plot
Keep risk and uncertainty in mind when using the following calculators on this web site:
- The Retirement Nest Egg Calculator
- The Retirement Savings Calculator
- The Retirement Age Calculator
- The Savings Calculator
As suggested in Great Minds. Great Wealth. Great for Your 401k, a financial advisor with a quantitative background, using a quality software package, can generate and explain the statistical probability of achieving specific outcomes for given inputs.
For your convenience, several consumer loan calculators are also on this web site. They include:
Figures from these calculators will likely differ in small amounts from calculations of the financial institutions. Why does this happen? It happens for a number of reasons, including, but not limited to:
- Compounding period used (continually, daily, monthly, annually etc.)
- Actual versus average days in a month
- Other reasons
However, by using these non-forecasting calculators you may be surprised at the numbers (outrageous interest rates, etc.) businesses and institutions often try to pull over on you for mundane things like automobile purchases, etc.
GreatWealth.com is not intended to take the place of a formally educated and seasoned, quantitative minded financial advisor; however, the calculators and information on this web site will help you to be a more informed investor and financial consumer.
The objective of GreatWealth.com, in combination with the book Great Minds. Great Wealth. Great for Your 401k, is to position you on the roller coaster of the stock market so that, over time, you not only come out significantly ahead, but also feel comfortable and confident with your financial stability and future. This, in turn, will substantially benefit your lifestyle, your relationships, your peace of mind and your quality of life.
Thank you for your time and consideration.
DISCLAIMER: Neither GreatWealth.com, nor Schulz Media, nor Schulz Financial nor any other entity directly or indirectly affiliated with this web site assume any risk or responsibility for the accuracy, implications, results or decisions made using the calculators contained herein.