We frequently hear, usually from a news correspondent who can’t add 3+2, that the USA doesn’t spend enough money on research and development. Further, those same pundits often claim the USA doesn’t have enough engineers and scientists. And to be sure, as an engineering and finance professional I often have the same concerns.
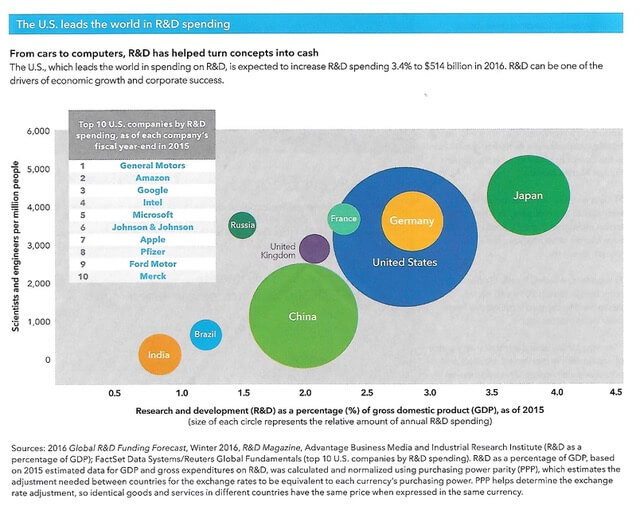
So, as usual, we need to turn to the facts. And what do the facts say? To my surprise, the USA leads most of the world in research & development spending as a percentage of gross domestic product (see graphic below). The USA also does well on scientists and engineers per capita. Further, as evidenced by having the biggest circle, the USA leads the world in total research and development spending.
Moreover, when you look at the bubbles keep in mind that the area (not the diameter, but the area) of the circle is proportional to total R&D spending, and the area of a circle equals pr2. Thus, if the USA bubble has a diameter that is five times that of France, for example, the USA spending on R&D spending is twenty-five times the R&D spending of France (52 = 25).
So how does all of this impact your portfolio? I haven’t seen any direct correlations between either R&D spending or per capita engineers and scientists by country to that country’s stock market growth. Nevertheless, it is something I need to keep an eye on as I consider your global portfolio balance, as technology has always been a key economic driver.
Thanks,
Rod